Assignment 1 Write Up
Examine graphs of
First let's examine the graph of this exponential function as the constant "a" varies while keeping variables "b" and "c" constant. For this case, let's let b=1 and c=0:
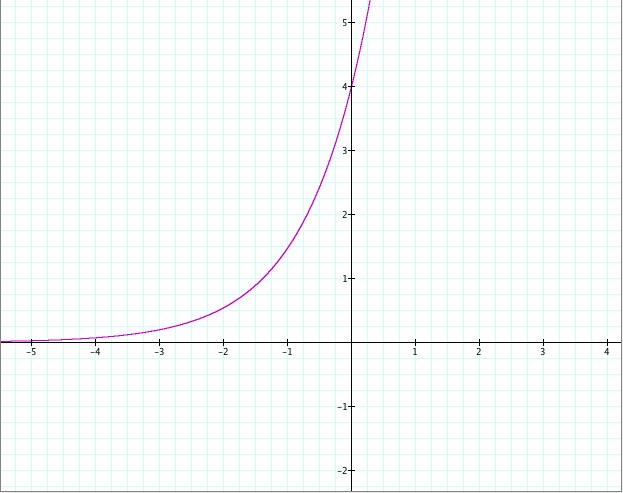
So lets observe that as "a" varies in the equation
, the y intercept varies proportionally. As the "a" increases, the y intercept of the exponential equational also increases. Matter of fact, the y-intercept actually equals the value of "a" in the exponential equation. To show this. let's observe when a=4:
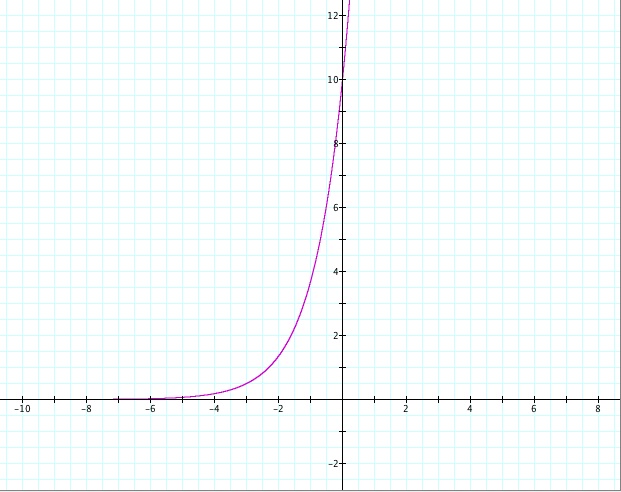
How about when a=10:
From the previous graphs, we can see that the y-intercept equals the value of "a" in the exponential function
Now let look at
When we vary the constant "b" in our exponential equation, we can see that the y-intercept does change and stays at one. We have already discussed that the y-intercept equals the value of "a". In this case "a=1." Therefore, no matter what the value of "b" may be the intercept will be one. We have already seen that when "a" varies the y-intercepts varies, but when "b" varies the slope of the tangent line to the graph varies. Lets observe the following graph:
As "B" varies in the equation
So we have explored the equation
Lets observe that when "c" varies, the slope of the tangent line (red line) at the point (1,1) stays constant at a slope of 1 and moves simultaneously with the exponential graph. The constant "c" varies the vertical shift of the graph. More or less, the horizontal asymptote (blue line) is varying as the constant "c" varies. Like most function graphs the constant "c" in the equation controls the vertical shift of the graph and in this equation
Lastly, lets observe the the special cases of the equation
The exponential part of the equation will disappear and we will get the horizontal line y=c. We can also explore the case: "What if b=0?": ( Then we get the graph of y=1+c because e^0 power is 1). So in conclusion, we have explored the graph as the constants "a", "b", and "c" vary and also what parts of the graph are varying as these constant vary. Hopefully this exploration gives the reader a better understanding of exponential equations and their graphs.